Quality in (and through) a Crisis
April 21, 2021
The Timing and Magnitude of High and Low Quality Returns During Crisis Periods Tend to Follow a Familiar Pattern
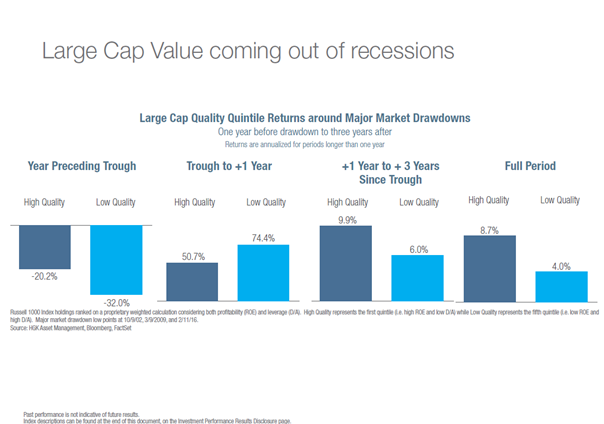
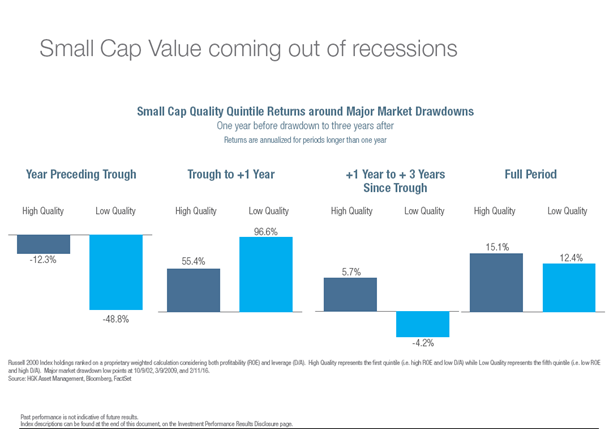
The post-COVID recovery has been led by low quality, cyclical names and looking at historical data we would certainly expect this to be the case. In the last three major drawdowns, the lowest quality quintile has been by far the strongest performer during the initial rally following the market’s bottoming. In wanting to examine this phenomenon more deeply, we took the last three major drawdown periods, the Tech Bubble (with its bottom on 10/9/02), the Great Financial Crisis (with its bottom on 3/9/09) and the drawdown following the oil market collapse (with its bottom on 2/11/16).
In wanting to approximate quality, we didn’t want to be too simplistic in just dividing up market segments by ROE, as this would lead to the inclusion of many high return, but commensurately high risk, businesses over the observation periods. We analyzed businesses during these time frames using a combined proprietary metric of ROE and Debt-to-Assets in order to limit businesses employing excessive leverage from inclusion in a category that we would term “High Quality”. In this manner, we ended up with a weighted grouping of quintiles based on the component stocks within both the Russell 1000 and Russell 2000 (not limiting the selection to Value or Growth but rather the Core indices) where those businesses with both a high ROE and low D/A would end up in the higher quality quintiles and those with low ROE and high D/A would find themselves in lower quality quintiles. We then looked at these cohorts of stocks, and their returns for the periods around the market low, observing the period from one year before the trough to three years following to get a sense for how markets reacted in these volatile times.
Good Investments During a Recession
What we discovered was a remarkable symmetry even though absolute return numbers can certainly vary greatly based on many extraneous factors which will certainly vary from crisis to crisis. In all periods, and summed up in the charts below, we saw that high quality names protected investors greatly in the initial, and substantial, drawdowns. The following year was then dominated by the low quality names which would have the greatest bounce as investors flocked to names with the greatest perceived valuation discrepancies. The following years were back to the high quality stocks outperforming again. As an investor, if your market timing is perfect, and you have the guts, you can certainly seem to shift portfolios from high to low quality at the bottom to take full advantage of this pattern, but as we see, remaining exposed to a portfolio of only the highest quality names throughout the period would yield consistently strong returns.

In examining the bigger picture, it is clear that over the full cycle we should expect higher quality firms to outperform. In this initial review we didn’t focus as much on the precise timing of reversals (perhaps that will be round two with this data) but instead focused more on the full year periods around the trough to get a sense of what investors should expect. As we have seen, regardless of capitalization, the quality of a company greatly influences its ability to generate returns for investors in periods of stress and while perhaps the higher leverage levels of the low quality quintile influence investors to move allocations to this group as momentum gathers behind a recovery, in the absence of perfect market timing, greater performance is captured by remaining in a High Quality portfolio of securities over the period.

We will continue to share our findings as we further develop any research around this topic. If you’d like to join the discussion, please don’t hesitate to reach out to us.
| Michael Pendergast, CFA | Matthew Kosara, CFA | David Ayres, CFA | Geoffrey Hauck, CFA | Helena Scholz, CFA |
| Chief Investment Officer | Chief Risk Officer | Portfolio Manager | Portfolio Manager | Portfolio Manager |
